
National Right to Life Committee, 2026
|
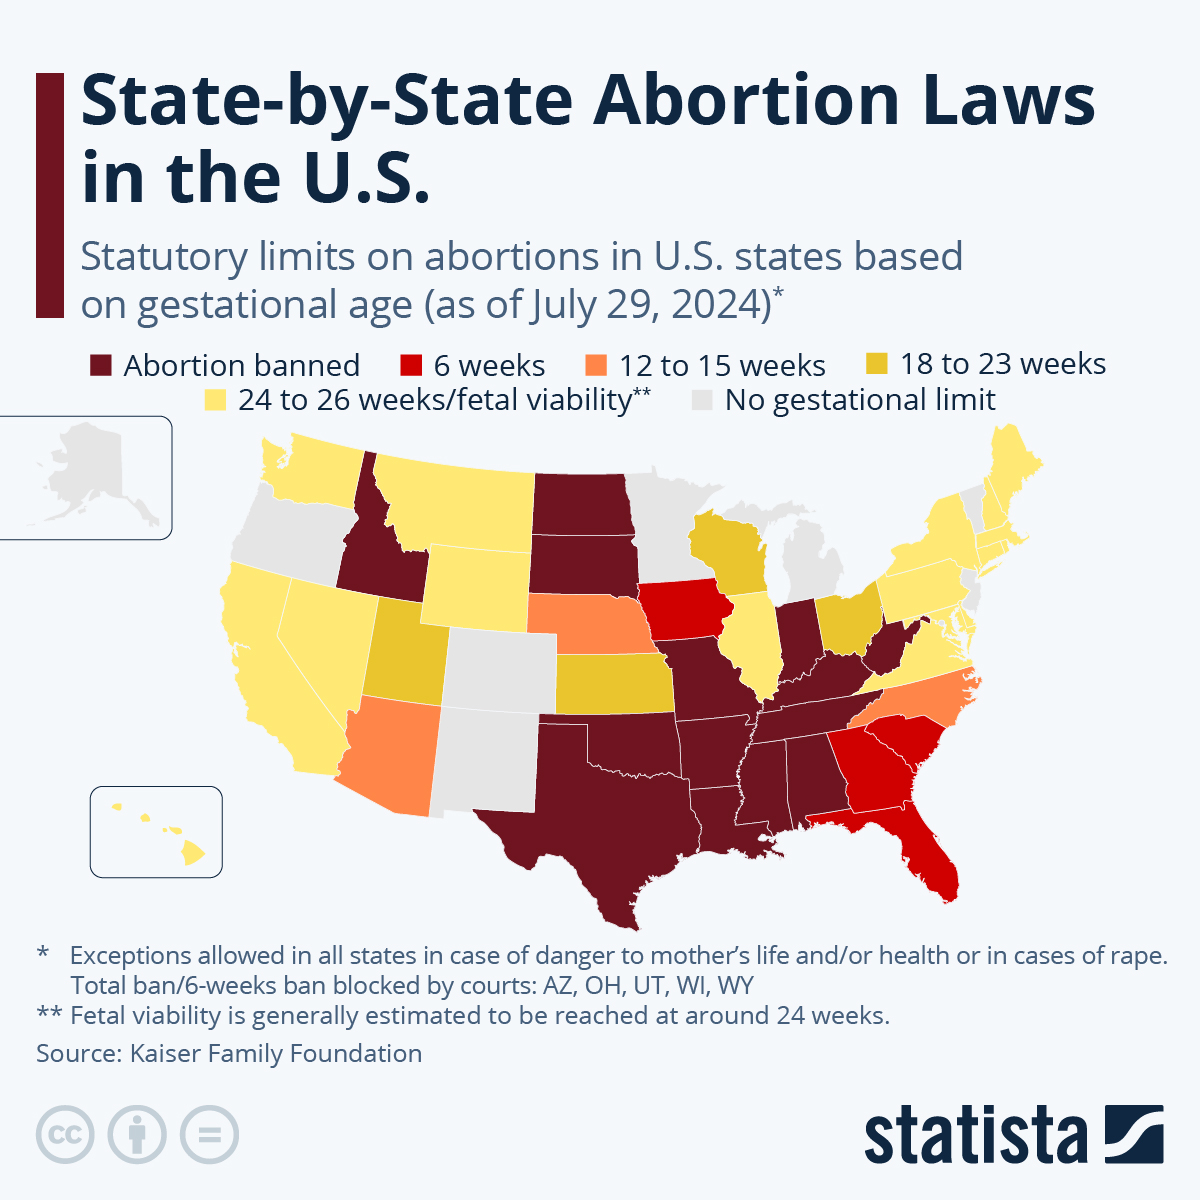
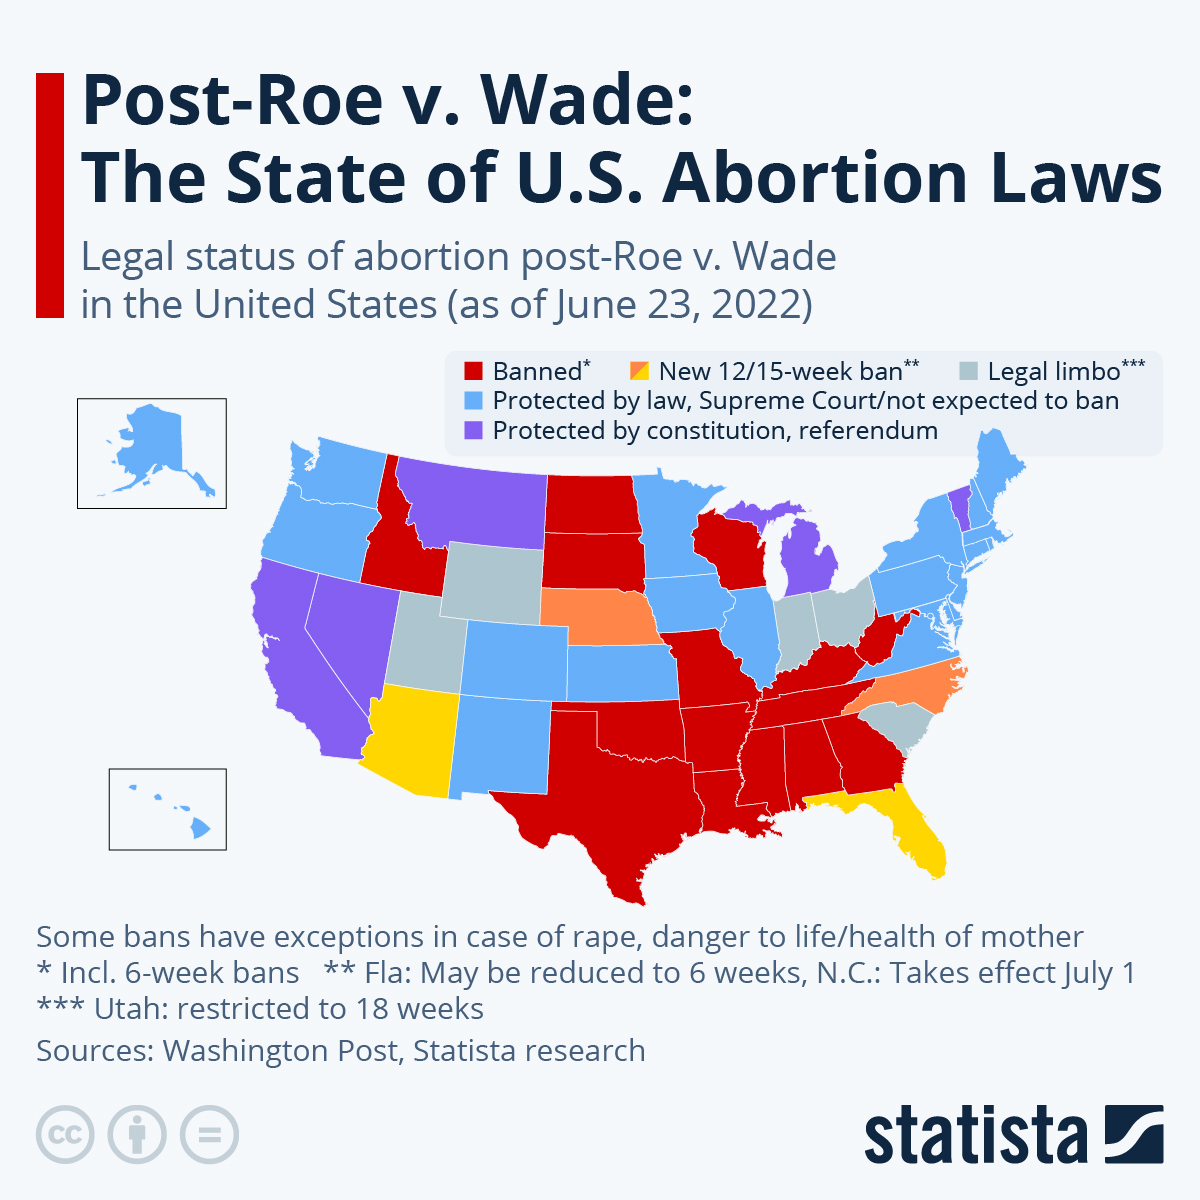
THE LEGACY OF ROE V. WADE 64 Million+ Lives Lost There were already abortions being performed in some states in the years before Roe,[1] but the Supreme Court’s decision in 1973 set off a tragic era that led to the loss of more than 64 million lives[2] in the U.S. over the next five decades.[3] 1. Several states legalized abortion before the Supreme Court’s decision in 1973. Early reports from the U.S. Centers for Disease Control (CDC) reported 22,670 for 1969, 193,491 for 1970, 485,816 for 1971, and 586,760 for 1972. CDC, “Abortion Surveillance: Annual Summary, 1972,” issued April 197 4. On file, available upon request. |
Reported Annual Abortions 1973-2025
Before Dobbs, there were two basic sources of abortion data in the U.S.:
- The U.S. Centers for Disease Control (CDC) publishes yearly, but relies on voluntary reports from state health departments. It has been missing data from CA, NH and at least one other state since 1998.
- The Guttmacher Institute (GI) contacts abortion clinics directly for data but does not always survey every year.
Both sources showed abortion skyrocketing after Roe, reaching a million annually in just a couple of years.
- Guttmacher showed abortion peaking at 1.6 million in 1990, but dropping from that point as different pro-life laws took effect.
- Abortion numbers, rates and ratios all fell over the next 25 years, reaching four-decade lows in 2016 and 2017.
- From that point on, they began to rise again, largely owing to the promotion and proliferation of abortion pills, which comprised 53% of all abortions in 2020.
Counting abortions became more difficult after Dobbs.
- Many clinics the CDC and GI relied upon for numbers closed, moved, or began sending clients out of state.
- Abortion pills were being promoted, sold on line and shipped to woman’s homes, often illegally.
The Society of Family Planning (SFP), surveyed its members in the months right before and after Dobbs.
- SFP saw an immediate drop in states that protect the unborn and some shift to abortion friendly states.
- Overall, SFP saw 25,050 fewer abortions from July of 2022 through the end of the year.
U.S. economists looking at states with legal protections for the unborn child after Dobbs found 32,000 additional births in the first six months of 2023.
Reported Annual Abortions – 1973-2025
YEAR GI CDC 1973 744,610 615,831 1974 898,570 763,476 1975 1,034,170 854,853 1976 1,179,300 988,267 1977 1,316,700 1,079,430 1978 1,409,600 1,157,776 1979 1,497,670 1,251,921 1980 1,553,890 1,297,606 1981 1,577,340 1,300,760 1982 1,573,920 1,303,980 1983 1,575,000 1,268,987 1984 1,577,180 1,333,521 1985 1,588,550 1,328,570 1986 1,574,000 1,328,112 1987 1,559,110 1,353,671 1988 1,590,750 1,371,285 1989 1,566,900 1,396,658 1990 1,608,600 1,429,247 1991 1,556,510 1,388,937 1992 1,528,930 1,359,146 1993 1,495,000 1,330,414 1994 1,423,000 1,267,415 1995 1,359,400 1,210,883 1996 1,360,160 1,225,937 1997 1,335,000 1,186,039 1998 1,319,000 884,273 * 1999 1,314,800 861,789 * 2000 1,312,990 857,475 * 2001 1,291,000 853,485 * 2002 1,269,000 854,122 * 2003 1,250,000 848,163 * 2004 1,222,100 839,226 * 2005 1,206,200 820,151 * 2006 1,242,200 846,181 * 2007 1,209,640 827,609 * 2008 1,212,350 825,564 * 2009 1,151,600 789,116 * 2010 1,102,670 765,651 * 2011 1,058,490 730,322 * 2012 1,011,000 699,202 * 2013 958,700 664,435 * 2014 926,190 652,639 * 2015 899,500 638,169 * 2016 874,100 623,471 * 2017 862,320 612,719 * 2018 871,806 ** 619,591 * 2019 916,160 629,898 * 2020 930,160 620,327 * 2021 976,668 ** 625,978 * 2022 499,060 ** 613,383* 2023 912,360 ** 2024 1,124,000 2025 1,126,000
* Excludes NH, CA, and at least one other state
** NRLC projection for calculation
Updated: January 2026
National Right to Life — Abortion Statistics: United States Data and Trends, January 2026
The report is available from the National Right to Life Communications Department here: https://nrlc.org/wp-content/uploads/2026/02/StatusofAbortion2026.pdf

Listen to our podcast
This post shows the statistics on abortion in our country, but we invite you to join us for a thought experiment in our podcast episode, “Outlawed or Unrestricted: What Really Changes.” Head over to our Life Challenges podcast page to listen and get access to all the other episodes we’ve recorded. You can also find the video on our YouTube channel below. If you found the podcast helpful, subscribe so you don’t miss an episode!

Trying to find abortion stats for 2016, 2017 and 2018
Hi Sheila, go to National Right to Life for the stats. This organization compiles the yearly information. Thanks!
This іs a nice rеview! Certainly a must-reaԁ and an eye-opener!
It jᥙst hеlped me thanks so much.
How many babies have been aborted approximately per year in the United States?
From the information above: Total abortions fell below 1 million for the first time in 2013 and have continued downward to 862,320 in the most recent figures for 2017.
Is the chart shown on this page an original compilation by Christian Life Resources, or is there a link to the data from the Guttmacher Institute and the CDC? I would like to be able to provide a citation to people I interact with that defend abortion. Thank you.
Hi, Scott – the statistics listed here are compiled from National Right to Life https://www.nrlc.org/ Thank you!
Over 63 million in total in 50years kind of sickening who knows what one of those babies could have grown up to be president Nobel prize winner a researcher that could have cured many dieses that effect mankind and remember that number is only the US